
Posted on
“Yay, it’s tax season!” – so says some crazy accountant somewhere. But I’m not an accountant and, to me, there are few things as frustrating as filing your taxes. First, I pull together 27 some odd documents named with just a number dash letter combination, all of which contain far too many boxes, asterisks, and subtext. Then, I fire up the old interweb browser, head to some online tax software, and try to follow the steps to file on my own. I have to at least attempt to save myself a few bucks by not hiring a professional. And so, the downward spiral of uncertainty and frustration begins…Is this number right? Is that how I should interpret that line item? Why can’t I deduct my home office? How many kids do I have again? Will I get a refund? Will I owe?!? Am I going to get audited? Oh boy, how much would that cost me? It is amazing that something with such lengthy, cumbersome, and detailed instructions can still leave me with a very vague understanding of what to do. Grrrr. Ultimately, I throw in the towel and look for that accountant that said “Yay, it’s tax season!” and pay for the peace of mind.
So, to take your mind off of all that, I wanted to pull together some fun facts and stats about taxes. And I mean fun in the absolute loosest sense of the word. And since we’re talking taxes, let's do this by the numbers.
-
150,000,000 – The number of tax returns filed in 2016, according to the latest data from IRS.gov.
-
10,400,000,000,000 – Yes that’s trillion and it represents the approximate dollars in total income for 2016. Almost 102 billion dollars were claimed in refundable tax credits. Of which, 86.3 billion dollars were issued as refunds to taxpayers while the remaining credits were used to offset income or other taxes.
-
1,100,000 – The number of tax returns which were audited in 2016. Of those, 70.8% were done via mail correspondence and the other 29.2% were done in the field with face-to-face interviews. There were roughly 933,000 audits that resulted in a recommendation of the individual paying more. On average, that amount was $21,918 for audits in the field and $6,014 for correspondence audits. Compare that to just 28,000 individual income tax audits that resulted in the individual getting a larger refund for an average of a staggering $31.26.
-
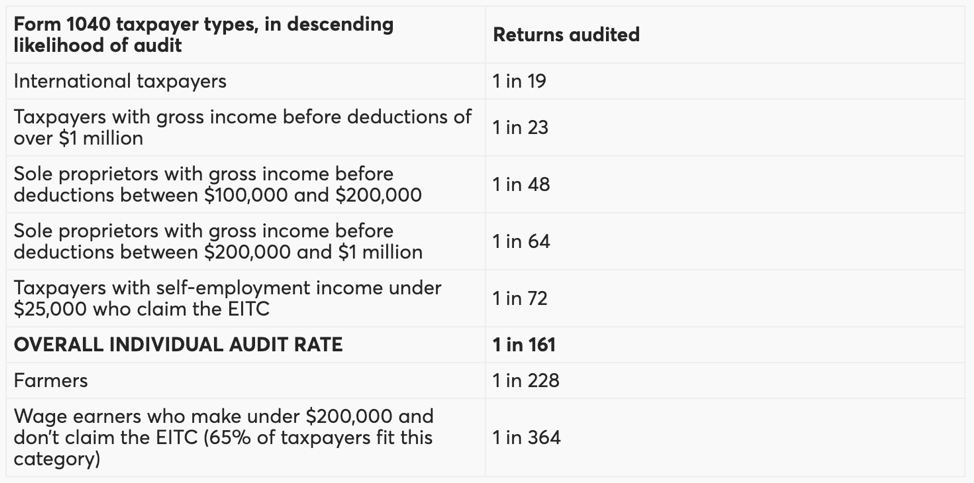
1 in 161 – Those are the chances of an audit for individuals, according to financial-planning.com based on the 2017 data. But, of course, not all returns have equal likelihood. Here is an interesting chart they’ve created that show some high and low likelihood groups:
-
92 - The percent of returns which are eFiled instead of filing a paper return, according to efile.com. This is great news for trees! Of the eFiled returns, 57.8% are completed by a professional and 42.2% are self-prepared.
-
5.4 - Most married couples file jointly but, in 2016, approximately 5.4% of married couples filed separately according to irs.gov. There are a few situations where this can be beneficial for tax purposes.
-
10,000 - The new cap for the State and Local Tax (SALT) deduction. Because of this, some payers are missing out on a big deduction that they used to take and some states are really feeling the effect. According to smartasset.com using data from 2014, here are the percentages of residents who took the deduction and the average deduction taken for some of those highly affected states:
-
New York – 34.14% - $21,038.02
-
Connecticut – 41.04% - $18,939.72
-
New Jersey – 41% - 17,183.33
-
California – 33.86% - $17,148.35
-
Washington D.C. – 39.19% - $15,452.40
-
-
7 – The number of states with no income tax. These states get their revenue through other taxes and if you live in one, you don’t even have to file! The 7 states are AL, FL, NV, SD, TX, WA, and WY. The rest of the states use one of two methods:
-
Flat tax. Everyone gets the same tax rate regardless of income level. A flat tax is used by CO, IL, IN, MA, MI, NC, PA, and UT.
-
Progressive tax. Here, your tax rate is based on your level of income and the more you make the higher your rate. This is used by all other states. There is quite a range of tax rates used throughout these states but it is worth noting that some states have very high rates for their top tax brackets such as HI (11%), NJ (8.97%), NY (8.82%), CA (13.3%), and MN (9.85%) just to name a few. See a full breakdown here at taxfoundation.org.
-
Hopefully, you found this interesting. Now, take a deep breath, tax season is almost over…unless you’re filing for an extension.
Questions, comments, feedback? jared@ware2now.com
Sources and additional reading:
https://www.irs.gov/pub/irs-soi/16inintaxreturns.pdf
https://www.irs.gov/statistics/enforcement-examinations
https://www.irs.gov/statistics/soi-tax-stats-individual-statistical-tables-by-filing-status
https://www.financial-planning.com/news/what-are-a-clients-chances-of-an-irs-audit
https://www.thebalance.com/state-income-tax-rates-3193320
https://www.efile.com/efile-tax-return-direct-deposit-statistics/
https://smartasset.com/taxes/trumps-plan-to-eliminate-the-state-and-local-tax-deduction-explained
Sign up for email updates, notifications on new blog posts, and local events.
Subscribe
